Building a Simple Network Protocol Analyzer in Rust
Learn how to build your own network packet analyzer from scratch using Rust
Building a Simple Network Protocol Analyzer in Rust
Hey there, today I bring you another technical post, whether it’s useful or not is up to you! Lately I found myself wanting to write an entire TCP/IP stack in Rust, or any other language for that matter, but to do that, I wanted to get some needed context on how these little “packet” things appear and fly around in magic land, so I built a simple network protocol analyzer, which is the focus of this post.
Network Protocol Analyzers
At their essence, network protocol analyzers (also known as packet sniffers) are tools that capture and inspect data packets as they travel across a network. They allow you to see the raw data being transmitted, helping with debugging, security analysis, or just understanding how networks actually work beneath all those abstractions we’re used to. You’ve probably used one of these already, I’d bet in the form of Wireshark, which is the gold standard for this sort of thing. But today, we’re building our own simplified version!
Why Rust?
If you’ve been following my blog, you know I’m a fan of Rust. Its memory safety guarantees, zero-cost abstractions, and performance make it perfect for systems programming tasks like network analysis. Plus, the ecosystem has matured enough that we have some really solid libraries for working with network packets. You can do this in most languages, I will write one in C as well, because I like pain sometimes.
Getting Started
Let’s bootstrap our project:
cargo new rust-packet-sniffer
cd rust-packet-sniffer
We’ll need a few dependencies for this project:
[dependencies]
pcap = "1.1.0"         # For capturing packets
etherparse = "0.13.0"  # For parsing packet contents
clap = { version = "4.3", features = ["derive"] } # For command-line args
anyhow = "1.0"         # For error handling
The pcap crate gives us bindings to the libpcap library (the same one used by Wireshark), etherparse helps us decode the binary packet data, clap makes command-line argument parsing less painful, and anyhow helps with error handling.
Understanding the Network Stack
Before diving into code, let’s quickly refresh our memory on how network communication works. The network stack is divided into layers, typically following the OSI model:
- Physical Layer - Electrical signals, cables, etc… (we won’t deal with this here, thank god)
- Link Layer - Ethernet frames, MAC addresses
- Network Layer - IP packets, routing (IPv4, IPv6)
- Transport Layer - TCP/UDP segments, ports
- Application Layer - HTTP, DNS, etc.
Our analyzer will capture packets at the link layer and then decode them up to the transport layer, showing the details of each packet.
The Code!
Let’s look at the high-level structure of our program:
- Parse command-line arguments (interface to capture on, packet count)
- Set up the packet capture on the selected interface
- Capture packets in a loop
- Analyze and display packet information
- Repeat until done
Command-Line Arguments
First, let’s setup our command-line interface using clap:
use clap::Parser;

#[derive(Parser, Debug)]
#[command(author, version, about, long_about = None)]
struct Args {
    /// Network interface to capture on
    #[arg(short, long)]
    interface: Option<String>,

    /// Number of packets to capture (0 for unlimited)
    #[arg(short, long, default_value_t = 10)]
    count: usize,
}
This gives us a nice -i/--interface option to specify which network interface to capture on,
and a -c/--count option to limit how many packets we capture.
Setting Up Packet Capture
Now, let’s set up the packet capture. We’ll list available network interfaces if none is specified:
fn main() -> Result<()> {
    let args = Args::parse();

    // List available devices if no interface provided
    let device = match &args.interface {
        Some(interface_name) => {
            Device::list()?
                .into_iter()
                .find(|d| d.name == *interface_name)
                .with_context(|| format!("Interface '{}' not found", interface_name))?
        }
        None => {
            println!("Available network interfaces:");
            for dev in Device::list()? {
                println!("- {}: {}", dev.name, dev.desc.unwrap_or_default());
            }
            return Ok(());
        }
    };

    println!("Capturing on device {}", device.name);
Then we create a capture handle with some configuration options:
    let mut cap = Capture::from_device(device)?
        .promisc(true)     // Capture all packets, not just ones addressed to this machine
        .snaplen(5000)     // Capture up to 5000 bytes of each packet
        .timeout(100)      // Timeout of 100ms to make our program more responsive
        .open()?;
The Capture Loop
Now for the main loop where we capture and process packets:
    let mut packet_count = 0;
    while args.count == 0 || packet_count < args.count {
        match cap.next_packet() {
            Ok(packet) => {
                packet_count += 1;

                println!("\n[Packet #{}] {} bytes", packet_count, packet.header.len);

                match SlicedPacket::from_ethernet(packet.data) {
                    Ok(value) => analyze_packet(value),
                    Err(err) => println!("Error parsing packet: {:?}", err),
                }
            }
            Err(pcap::Error::TimeoutExpired) => {
                // Just try again on timeout - this makes the program more responsive
                continue;
            }
            Err(err) => {
                println!("Error receiving packet: {:?}", err);
                break;
            }
        }
    }
Here we’re capturing packets in a loop until we reach the count specified (or forever if count is 0). For each packet, we parse it using etherparse and then analyze it.
Packet Analysis
The heart of our tool is the packet analysis function:
fn analyze_packet(packet: SlicedPacket) {
    // Analyze link layer
    if let Some(link) = &packet.link {
        println!("Link layer: {:?}", link);
    }

    // Analyze network layer
    match &packet.ip {
        Some(InternetSlice::Ipv4(ipv4, _)) => {
            let source = ipv4.source_addr();
            let dest = ipv4.destination_addr();

            println!("IPv4: {} -> {}", source, dest);
            println!("Protocol: {}", ipv4.protocol());
        }
        Some(InternetSlice::Ipv6(ipv6, _)) => {
            let source = Ipv6Addr::from(ipv6.source_addr());
            let dest = Ipv6Addr::from(ipv6.destination_addr());

            println!("IPv6: {} -> {}", source, dest);
            println!("Next Header: {}", ipv6.next_header());
        }
        None => println!("No IP layer found"),
    }

    // Analyze transport layer
    match &packet.transport {
        Some(TransportSlice::Tcp(tcp)) => {
            println!("TCP: Port {} -> {}", tcp.source_port(), tcp.destination_port());
            println!("Flags: SYN={} ACK={} FIN={} RST={}",
                tcp.syn(), tcp.ack(), tcp.fin(), tcp.rst());
            println!("Sequence: {}, Window: {}", tcp.sequence_number(), tcp.window_size());
        }
        Some(TransportSlice::Udp(udp)) => {
            println!("UDP: Port {} -> {}", udp.source_port(), udp.destination_port());
            println!("Length: {}", udp.length());
        }
        Some(TransportSlice::Icmpv4(_)) => {
            println!("ICMPv4 packet");
        }
        Some(TransportSlice::Icmpv6(_)) => {
            println!("ICMPv6 packet");
        }
        Some(TransportSlice::Unknown(u)) => {
            println!("Unknown transport protocol: {}", u);
        }
        None => println!("No transport layer found"),
    }

    // Analyze payload if present
    let payload = &packet.payload;
    if !payload.is_empty() {
        println!("Payload: {} bytes", payload.len());

        // Print the first few bytes of the payload
        let preview_len = std::cmp::min(16, payload.len());
        print!("Preview: ");
        for byte in &payload[0..preview_len] {
            print!("{:02x} ", byte);
        }
        println!();
    } else {
        println!("Payload: empty");
    }
}
This function works through each network layer:
- Link Layer: Displays the Ethernet information
- Network Layer: Handles IPv4 and IPv6 packets
- Transport Layer: Decodes TCP, UDP, and ICMP packets
- Application Layer: Shows a preview of the raw payload data
The etherparse crate does most of the heavy lifting here, parsing the binary packet data into structured data we can easily work with.
Putting It All Together
The complete program combines all these parts, giving us a basic but functional network analyzer that can:
- List available network interfaces
- Capture packets on a specified interface
- Parse and display packet information across multiple layers
- Filter by packet count
Running the Analyzer
To run the analyzer, you’ll need appropriate permissions to capture packets. On Linux, you can either run with sudo or set the necessary capabilities on the binary:
# Running with sudo
sudo cargo run -- -i eth0 -c 20

# Or set capabilities (one-time setup)
sudo setcap cap_net_raw,cap_net_admin=eip target/debug/rust-packet-sniffer
cargo run -- -i eth0 -c 20
On macOS and Windows, you might need administrator privileges.
Sample Output
If you run the analyzer as is, without any arguments, a list of interfaces available should be given to you:
-> network_protocol_analyzer sudo ./target/release/network_protocol_analyzer
Available network interfaces:
- eth0:
- any: Pseudo-device that captures on all interfaces
- lo:
- bluetooth-monitor: Bluetooth Linux Monitor
- nflog: Linux netfilter log (NFLOG) interface
- nfqueue: Linux netfilter queue (NFQUEUE) interface
- dbus-system: D-Bus system bus
- dbus-session: D-Bus session bus
Once you run it with -i/--interface {interface_name} and potentially a count, you will see
the packets come in in real time. They should look like:
[Packet #1] 81 bytes
Link layer: Ethernet2(Ethernet2HeaderSlice {
    slice: [1, 0, 94, 0, 0, 251, 0, 21, 93, 208, 20, 224, 8, 0] })
IPv4: 172.22.208.1 -> 224.0.0.251
Protocol: 17
UDP: Port 5353 -> 5353
Length: 47
Payload: 39 bytes
Preview: 00 00 00 00 00 01 00 00 00 00 00 00 0a 5f 65 7a
This shows an Ethernet packet containing an IPv4 packet with a TCP segment. It’s a SYN packet (the start of a TCP connection) from port 54321 to port 443 (HTTPS).
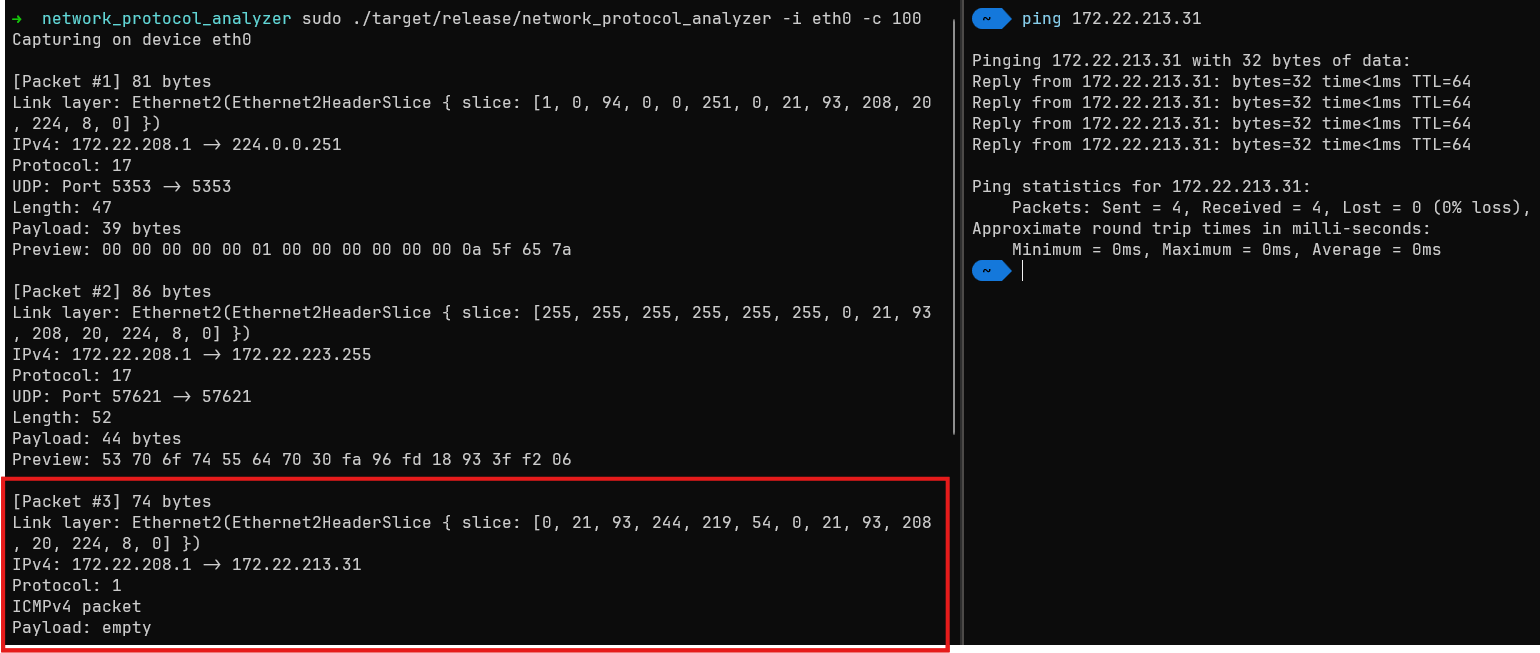
An illustration of me pinging from a host into a WSL ubuntu instance can be seen below too:
Extensions and Improvements
This is just a starting point. Here are some ways you could extend this tool:
- Protocol Decoders: Add application-layer protocol decoders for HTTP, DNS, etc.
- Filtering: Add BPF (Berkeley Packet Filter) support to filter packets
- Statistics: Collect and display traffic statistics
- Packet Saving: Save captured packets to a PCAP file for later analysis
- TUI/GUI: Add a text-based or graphical interface
Conclusion
Building a network protocol analyzer in Rust is a great way to learn about both networking and systems programming. The Rust ecosystem provides excellent tools for this kind of work, and the language’s safety guarantees help prevent the kinds of bugs that could be disastrous in networking code.
This simple analyzer is just scratching the surface of what’s possible, but it demonstrates the basic principles and can be a foundation for more complex tools.
Now go forth and sniff some packets (legally and ethically, of course)!